11 high priority target areas have been defined for follow-up exploration on the Lemhi property
633 soil samples and 145 rock grab and channel samples analysed
565 line km of ground magnetics and 1.4 sq. km of 3D IP Data surveyed, and integrated with finalized historical data compilation and interpretation finalized
Grab samples discovered 5 targets with a total of 54 samples >1 g/t Au with assay values up to 450 g/t Au
Geophysical interpretation has outlined a target on strike of the known mineralized body with very similar geophysical characteristics
All targets are currently not drill tested and additional claims have been staked near certain targets
SALMON, Idaho, May 6, 2021 /CNW/ – Freeman Gold Corp. (CSE: FMAN) (OTCQB: FMANF) (FSE: 3WU) (“Freeman” or the “Company“) is pleased to provide 2020 exploration results on its 100% owned Lemhi Gold Project located in Idaho. During the 2020 field season a total of 633 soil samples were collected along with 145 rock grab and channel samples. Comprehensive geophysical surveys were completed, consisting of 565 line km of ground magnetics covering almost the entire property and 1.4 square km of 3D IP Data over the known mineralized zone. In addition, historical data compilation and interpretation were finalized and incorporated into the exploration data base. As a result of the surface exploration campaign 11 high quality targets have been identified (Table 1), demonstrating the prospective nature of Freeman’s land package. None of these targets have been drill tested to date.
Will Randall, President and CEO of Freeman, commented, “The exploration results demonstrate that targets both in close proximity and further afield from the known Lemhi mineralized gold oxide zone exist throughout the property. Since Freeman is the first company to have a large consolidated land package along the major northeast structure, we feel confident we are on the right track to make additional gold discoveries.”
Table 1 – Priority exploration targets and summarized description on the Lemhi property, Idaho
Rock Grab Samples
Prospecting and sampling was completed over the entire Lemhi property. Of the 145 rock grab samples collected 54 returned assay values greater than 1 gram per tonne gold (g/t Au) and 20 greater than 5 g/t Au (up to 450 g/t Au). Of the 145 rock grab samples collected 27 samples contain greater than 10 grams per tonne Silver (g/t Ag), with values up to 219 g/t Ag. Mineralization was within phyllites, quartzites and quartz veins and appears similar to that of known mineralization at Lemhi. These results have identified five new exploration target areas for priority follow-up. Follow-up exploration at each of the target areas will include but not be limited to prospecting, mapping, soil sampling and possibly drilling. The results are shown on Figure 1 and highlights are in Table 2 (Targets 1, 2, 6, 7, 8; Figure 1).
*Rock grab samples are by their nature selective and are not necessarily indicative of the general geology or the grade within the Property. Ppm=parts per million or grams per tonne.
Ground Magnetics
During 2020, ground magnetics were collected over the entire Lemhi Property using GEM Overhauser walking magnetometers with DGPS. The regional grid was completed at 25 meter line spacing, and the known mineralized area was completed at 12.5 meter line spacing, totaling approximately 565 line kilometers of magnetics.
The purpose of the survey was to identify the prospective geological boundaries and structures throughout the property. Of known importance is the boundary between the intrusion(s) and the Proterozoic meta-sediments, where the known gold mineralization at Lemhi occurs along and near the margins of the defined intrusion. Of importance throughout the region is the presence of northeast trending structures interpreted to be associated with known mineralization throughout the region.
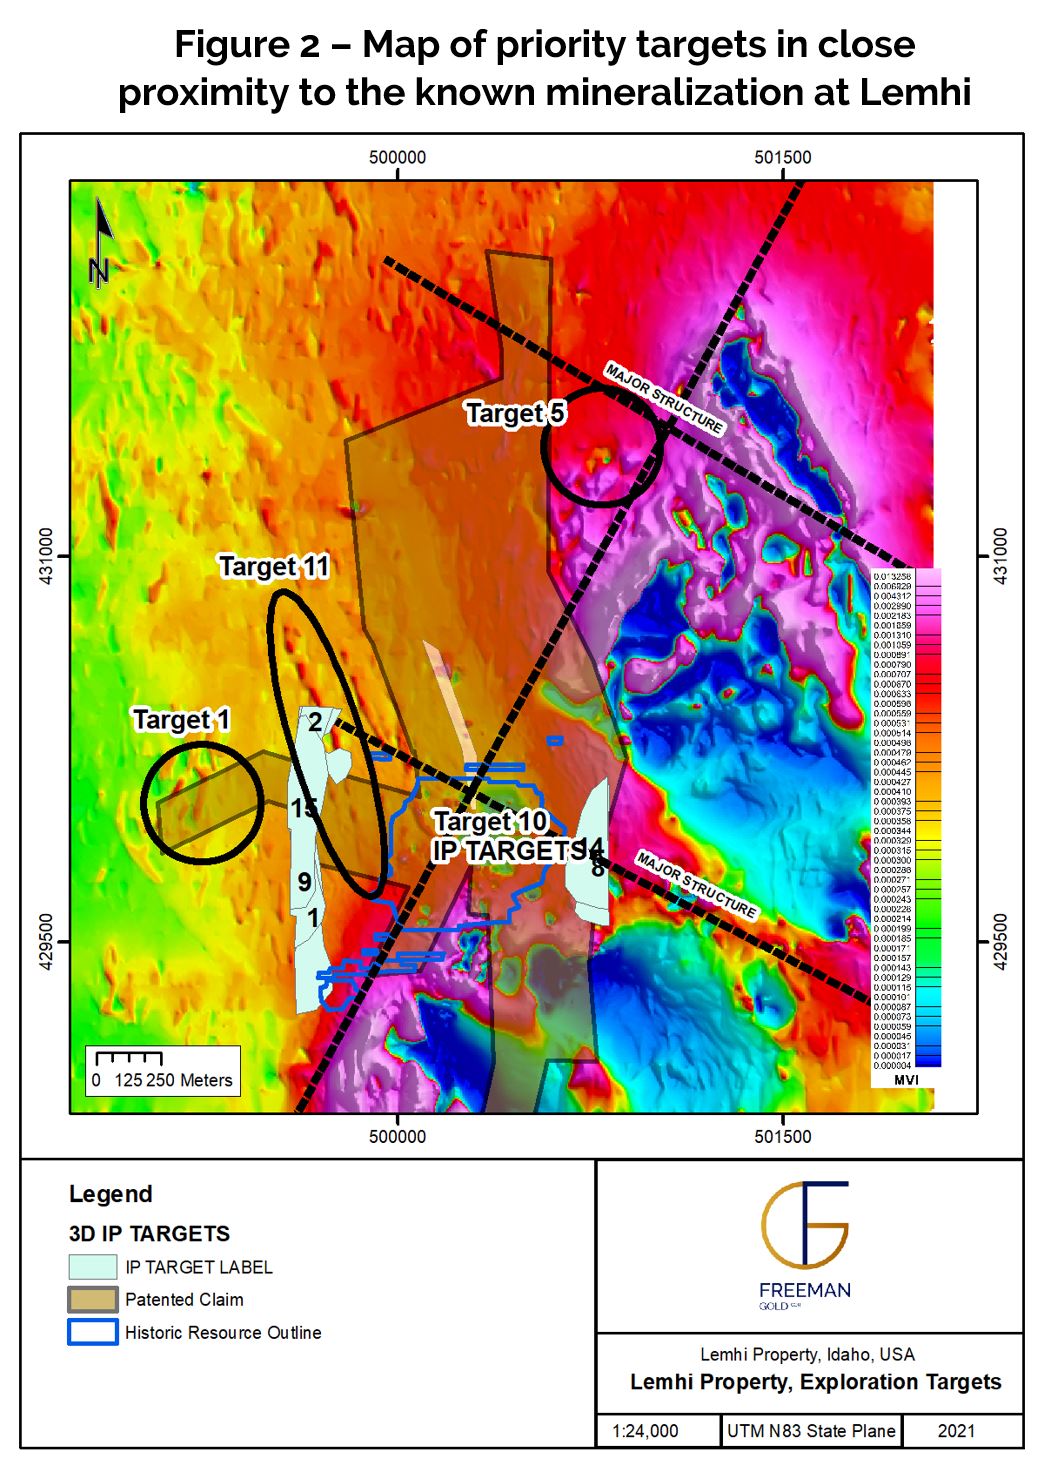
As shown in Figures 1 & 2 the survey was successful in identifying the boundary between the intrusion(s) and the Proterozoic meta-sediments, following clear extensions of the known gold mineralization at Lemhi. In addition, this boundary or contact has been mapped for 7 kilometers along a major northeast trending structure that follows the direction of important regional structures. The survey has also shown secondary west-northwest structures that intersect these major lineaments and boundaries. One such intersection occurs in the area where known gold mineralization has been defined by over 70,000 meters of drilling, while a second intersection has been interpreted 1.7 kilometers along strike and northeast of the known mineralization, such that is exhibits structural similarities to the known mineralization (Target 5; Figures 1 & 2).
Another NW trending high priority feature has been identified (Target 11; Figure 1 & 2). Target 11 represents a 1.2 km long linear magnetic body extending NNW, parallel to the intrusive contact, and located within a region favourable for extrusive bodies. The wavelength of the anomaly’s magnetic signal suggests that the causative body is shallow and near surface. The northern end of the magnetic anomaly is intersected by a secondary fault, paralleling the main fault. IP targets 1, 3, 9, 15, and 16 border the southern end of the magnetic anomaly, while the centre of the anomaly is coincident with IP target 2, where the main fault that borders the north end of the mineralized area appears to terminate.
Data Compilation
After completing compilation of historical drill and resource related data, all historical data pertaining to surface exploration has been scanned and integrated into Freeman’s database. The regional data identified two new additional target areas with coincidental gold in rock grab and gold in soil anomalies which were never followed up by previous operators. Historical samples at Targets 3, 4 and 9 (Figure 1) contain rock grab and chip samples with results from 0.015 g/t Au, up to 38.23 g/t Au. In total, 529 historical rock grab and chip samples were digitized of which 56 contained greater than 1 g/t Au.
3D IP Survey
A Dias Geophysical Limited 3D Induced Polarisation (‘3D IP’) was carried out during September and October of 2020. The survey area consisted of a 1.4 km X 1.4 km area centered over the area with known mineralization, which extends roughly 650 meters east-west by 500 meters north-south. The survey was designed to characterize the geophysical signature of the deposit and possibly define new areas of gold mineralization and extensions of the known mineralized zones delineated by drilling.
Two major contacts have been interpreted. The strongest one follows an east-northeast curvi-linear trend where chargeabilities are generally low and resistivities are very low to the south-southeast. This contact is also coincident with a magnetic high trend. The second major contact trends north-south, located on the west side of the survey block and is characterized by low chargeability coincident with low resistivity.
Three high priority and two moderate priority anomalies have been defined (Figure 2). The first high priority is an area of elevated resistivity that is partially coincident with the northern limit of the gold grade zone. The second is a large north-south trending zone of high resistivity and high chargeability located at the western boundary of the survey block that is unbounded to the west. The third is a zone of high chargeability located at the eastern border of the survey block and unbounded to the east. The first moderate priority is a north-south trending zone of high resistivity and high chargeability adjacent to the northwestern boundary of the gold grade zone that is only seen in the shallow depth slices. The second moderate priority is a zone of high chargeability that straddles the southwestern portion of the mineralized zone and is seen only in the deep depth slices. The anomalies require drill testing and are shown on Figure 2. If additional gold mineralization is intersected, the IP survey should be extended to define the extent of the anomalies. As well, 3D IP could then be used as an important exploration tool in other areas with coincident anomalies to better define buried mineralization.
Soil Samples
In order to further refine targets in order to get them drill ready Freeman anticipates completing soil surveys over the priority target areas in order to more accurately target discovery drilling. To ensure proper results orientation soil samples were collected in areas of known mineralization using three different soil sampling methodologies: (i) conventional B Horizon sampling; (ii) Ionic Leach sampling; and (iii) Mobile Metal Ion (‘MMI’) sampling. Samples were collected every 25 meters at depths of: 0 to 10 cm; 10 to 20 cm; 20 to 30 cm; and 30 to 40 cm. It was determined that Ionic Leach sampling at 20 to 40 cm’s would be the best sampling methodology moving forward to not only detect buried gold, silver and copper mineralization but alteration using calcium and potassium.
Freeman has mobilized crews to site to complete Ionic Leach soil sample surveys over certain priority targets.
About the Lemhi Gold Project
The Lemhi Gold Project lies within the Idaho-Montana porphyry belt, a northeast-trending alignment of metallic ore deposits related to granitic porphyry intrusions that extend north-easterly across Idaho related to the Trans-Challis fault system, a broad (20-30 km-wide) system of en-echelon northeast-trending structures extending from Boise Basin more than 270 km into Montana. At Lemhi gold mineralization is hosted in Mesoproterozoic quartzites and phyllites within a series of relatively flat-lying lodes consisting of quartz veins, quartz stockwork and breccias. The mineralized lodes are associated with low angle faults, folding and shear zone(s). The mineralized zones have varying amounts of sulphides (pyrite, chalcopyrite, bornite, molybdenum, and occasionally arsenopyrite) and free gold is common. The mineralization remains open at depth and in multiple directions.
All rock samples were sent to ALS Global Laboratories (Geochemistry Division) in Vancouver, Canada, an independent and fully accredited laboratory (ISO 9001:2008) for analysis for gold by Fire Assay and multi-element Induction Coupled Plasma Spectroscopy (select drill holes). Freeman has a regimented Quality Assurance, Quality Control (“QA/QC”) program where at least 10% duplicates, blanks and standards are inserted into each sample shipment.
The technical content of this release has been reviewed and approved by Dean Besserer, P. Geo., VP Exploration for the Company and a Qualified Person as defined by the National Instrument 43-101.
About the Company
Freeman Gold Corp. is a mineral exploration company focused on the development of its 100% owned Lemhi Gold property (the “Lemhi Project“). The Lemhi Project comprises 30 square kilometers of highly prospective land. The mineralization at the Lemhi Project consists of shallow, near surface primarily oxide gold mineralization that has seen over 355 drill holes but remains open at depth and in multiple directions. The Company is working towards de-risking the asset and producing a maiden National Instrument 43-101 compliant resource estimate as a result of both brownfield and greenfield exploration.
On Behalf of the Company William Randall, President & CEO
Forward Looking Statements: This press release contains “forward–looking information or statements” within the meaning of Canadian securities laws, which may include, but are not limited to statements relating to its future business plans. All statements in this release, other than statements of historical facts, that address events or developments that the Company expects to occur, are forward-looking statements. Forward-looking statements are statements that are not historical facts and are generally, but not always, identified by the words “expects”, “plans”, “anticipates”, “believes”, “intends”, “estimates”, “projects”, “potential” and similar expressions, or that events or conditions “will”, “would”, “may”, “could” or “should” occur. Although the Company believes the expectations expressed in such forward-looking statements are based on reasonable assumptions, such statements are not guarantees of future performance and actual results may differ from those in the forward-looking statements. Such forward-looking information reflects the Company’s views with respect to future events and is subject to risks, uncertainties and assumptions. The Company does not undertake to update forward–looking statements or forward–looking information, except as required by law.
Neither Canadian Securities Exchange nor its regulation services provider accepts responsibility for the adequacy or accuracy of this release.
Receive Updates
Get exclusive updates delivered right to your inbox but subscribing to our mailing list.
TSX Venture Exchange: FMAN VANCOUVER, BRITISH COLUMBIA – November 30, 2023 – Freeman Gold Corp. (TSXV: FMAN, OTCQX: FMANF, FSE: 3WU) (“Freeman” or the “Company”)
Vancouver, British Columbia – June 29, 2026 – Freeman Gold Corp. (TSXV: FMAN, OTCQB: FMANF, FSE: 3WU) (“Freeman” or the “Company“) is pleased to announce
VANCOUVER, BRITISH COLUMBIA – May 5, 2026 – Freeman Gold Corp. (TSXV: FMAN, OTCQB: FMANF, FSE: 3WU) (“Freeman” or the “Company”) is pleased to announce
VANCOUVER, BRITISH COLUMBIA – April 8, 2026 – Freeman Gold Corp. (TSXV: FMAN, OTCQB: FMANF, FSE: 3WU) (“Freeman” or the “Company”) is pleased to announce
VANCOUVER, BRITISH COLUMBIA – February 5, 2026 – Freeman Gold Corp. (TSXV: FMAN, OTCQB: FMANF, FSE: 3WU) (“Freeman” or the “Company”) is pleased to announce
VANCOUVER, BRITISH COLUMBIA – January 13, 2026 – Freeman Gold Corp. (TSXV: FMAN, OTCQB: FMANF, FSE: 3WU) (“Freeman” or the “Company”) is pleased to announce
Vancouver, BC – January 6, 2026 – Freeman Gold Corp. (TSXV: FMAN; OTCQB: FMANF; FSE: 3WU) (“Freeman” or the “Company”) is proud to announce a transformative
VANCOUVER, BRITISH COLUMBIA – December 9, 2025 –Freeman Gold Corp. (TSXV: FMAN, OTCQB: FMANF, FSE: 3WU) (“Freeman” or the “Company”) is pleased to announce
VANCOUVER, BRITISH COLUMBIA – December 4, 2025 – Freeman Gold Corp. (TSXV: FMAN, OTCQB: FMANF, FSE: 3WU) (“Freeman” or the “Company”) is pleased to announce
VANCOUVER, BRITISH COLUMBIA – October 24, 2025 – Freeman Gold Corp. (TSXV: FMAN, OTCQB: FMANF, FSE: 3WU) (“Freeman” or the “Company”) is pleased to announce
VANCOUVER, BRITISH COLUMBIA – October 22, 2025 – Freeman Gold Corp. (TSXV: FMAN, OTCQB: FMANF, FSE: 3WU) (“Freeman” or the “Company”) is pleased to announce
VANCOUVER, BRITISH COLUMBIA – September 23, 2025 – Freeman Gold Corp. (TSXV: FMAN, OTCQB: FMANF, FSE: 3WU) (“Freeman” or the “Company”) is pleased to announce
VANCOUVER, BRITISH COLUMBIA – September 15, 2025 – Freeman Gold Corp. (TSXV: FMAN, OTCQB: FMANF, FSE: 3WU) (“Freeman” or the “Company”) is pleased to announce
VANCOUVER, BRITISH COLUMBIA – August 26, 2025 – Freeman Gold Corp. (TSXV: FMAN, OTCQB: FMANF, FSE: 3WU) (“Freeman” or the “Company”) is pleased to announce
//NOT FOR DISTRIBUTION TO UNITED STATES NEWSWIRE SERVICES OR FOR DISSEMINATION IN THE UNITED STATES// VANCOUVER, BRITISH COLUMBIA – August 18, 2025 – Freeman Gold
NOT FOR DISTRIBUTION TO UNITED STATES NEWSWIRE SERVICES OR FOR DISSEMINATION IN THE UNITED STATES VANCOUVER, BRITISH COLUMBIA – August 6, 2025 – Freeman Gold
VANCOUVER, BRITISH COLUMBIA – July 15, 2025 – Freeman Gold Corp. (TSXV: FMAN, OTCQB: FMANF, FSE: 3WU) (“Freeman” or the “Company”) is pleased to announce
VANCOUVER, BRITISH COLUMBIA – June 9, 2025 – Freeman Gold Corp. (TSXV: FMAN, OTCQB: FMANF, FSE: 3WU) (“Freeman” or the “Company”) is pleased to announce
VANCOUVER, BRITISH COLUMBIA – May 27, 2025 – Freeman Gold Corp. (TSXV: FMAN, OTCQB: FMANF, FSE: 3WU) (“Freeman” or the “Company”) is pleased to provide
VANCOUVER, BRITISH COLUMBIA – May 20, 2025 – Freeman Gold Corp. (TSXV: FMAN, OTCQB: FMANF, FSE: 3WU) (“Freeman” or the “Company”) is pleased to announce
VANCOUVER, BRITISH COLUMBIA – May 15, 2025 – Freeman Gold Corp. (TSXV: FMAN, OTCQB: FMANF, FSE: 3WU) (“Freeman” or the “Company”) is pleased to announce
VANCOUVER, BRITISH COLUMBIA – April 14, 2025 – Freeman Gold Corp. (TSXV: FMAN, OTCQB: FMANF, FSE: 3WU) (“Freeman” or the “Company”) is pleased to announce
VANCOUVER, BRITISH COLUMBIA – April 9, 2025 – Freeman Gold Corp. (TSXV: FMAN, OTCQB: FMANF, FSE: 3WU) (“Freeman” or the “Company”) is pleased to announce
VANCOUVER, BRITISH COLUMBIA – March 26, 2025 – Freeman Gold Corp. (TSXV: FMAN, OTCQB: FMANF, FSE: 3WU) (“Freeman” or the “Company”) welcomes President Donald Trump’s Executive
VANCOUVER, BRITISH COLUMBIA – March 24, 2025 – Freeman Gold Corp. (TSXV: FMAN, OTCQB: FMANF, FSE: 3WU) (“Freeman” or the “Company”) is pleased to announce
VANCOUVER, BRITISH COLUMBIA – February 26, 2025 – Freeman Gold Corp. (TSXV: FMAN, OTCQB: FMANF, FSE: 3WU) (“Freeman” or the “Company”) is pleased to announce
VANCOUVER, BRITISH COLUMBIA – February 10, 2025 – Freeman Gold Corp. (TSXV: FMAN, OTCQB: FMANF, FSE: 3WU) (“Freeman” or the “Company”) is pleased to announce
VANCOUVER, BRITISH COLUMBIA – December 10, 2024 – Freeman Gold Corp. (TSXV: FMAN, OTCQB: FMANF, FSE: 3WU) (“Freeman” or the “Company”) is pleased to announce
VANCOUVER, BRITISH COLUMBIA – December 4, 2024 – Freeman Gold Corp. (TSXV: FMAN, OTCQB: FMANF, FSE: 3WU) (“Freeman” or the “Company”) is pleased to announce
VANCOUVER, BRITISH COLUMBIA – December 2, 2024 – Freeman Gold Corp. (TSX-V: FMAN, OTCQB: FMANF, FSE: 3WU) (“Freeman Gold”, “Freeman” or the “Company”) is pleased
VANCOUVER, BRITISH COLUMBIA – October 16, 2024 – Freeman Gold Corp. (TSX-V: FMAN) (“Freeman”or the“Company”) is pleased to announce that it has closed its non-brokered private
VANCOUVER, BRITISH COLUMBIA – October 2, 2024 – Freeman Gold Corp. (TSX-V:FMAN) (“Freeman” or the “Company”) is pleased to announce that it has arranged a
Toronto Venture Stock Exchange: FMAN VANCOUVER, BRITISH COLUMBIA – August 8, 2024 – Freeman Gold Corp. (TSXV: FMAN, OTCQB: FMANF, FSE: 3WU) (“Freeman” or the
VANCOUVER, BRITISH COLUMBIA – October 16, 2023 – Freeman Gold Corp. (TSXV: FMAN, OTCQX: FMANF, FSE: 3WU) (“Freeman” or the “Company”) is pleased to announce
Freeman has recently received metallurgical results from tests conducted on two composite samples by Base Metallurgical Laboratories Limited, Kamloops, in conjunction with Ausenco Engineering Canada
Updated Lemhi Mineral Resource Estimated (“MRE”) increases contained ounces by 24%, overall gold grade by 16% and percentage of the MRE in Measured and Indicated
All 71 drill holes from the Phase 2 diamond drill program and Phase 3 reverse circulation drill program intersected shallow oxide gold mineralization within existing
Drilled eight additional holes (722 metres core in five holes; 509 metres reverse circulation in three holes) at the Beauty Zone after discovery hole FG21-003C
Expansion and infill drilling successfully extends known mineralization at Lemhi 350 metres south and southwest of previous drilling by Freeman Phase 2 diamond drill holes
Following a significant capital raise of US$13M @ US$0.35 in late 2021: Completed multi-phased drill programs totaling 15,349m in 71 drill holes (58 core holes/13
Phase 2 drill holes continue to intersect shallow oxide gold mineralization within existing resource pit both along strike and at depth Expansion hole FG22-001C returned
Expansion and infill drilling successfully extends known mineralization at Lemhi up to 80 metres to the east Drill program intersects shallow oxide gold mineralization within
Completed 50 resource expansion and infill diamond drill holes at Lemhi totaling 12,168 metres; Lehmi drill program designed to extend the known mineralization, typically consisting
VANCOUVER, BRITISH COLUMBIA – June 23, 2022 – Freeman Gold Corp. (TSXV: FMAN, OTCQX: FMANF, FSE: 3WU) (“Freeman” or the “Company”) is pleased to announce
• Idaho Department of Water Resources approved Freeman’s Permit to Appropriate Water No. 75-15005 • Allows for water rights for both mining and domestic use
Plan of Operations approves drilling on 28 new pads off patented claims Allows testing of 4 high priority exploration targets and 22 resource expansion and
VANCOUVER, BRITISH COLUMBIA – March 30, 2022 – Freeman Gold Corp. (TSXV: FMAN, OTCQX: FMANF, FSE: 3WU) (“Freeman” or the “Company”) wishes to provide clarification
VANCOUVER, BRITISH COLUMBIA – March 25, 2022 – Freeman Gold Corp. (TSXV: FMAN, OTCQX: FMANF, FSE: 3WU) (“Freeman” or the “Company”) is pleased to announce
